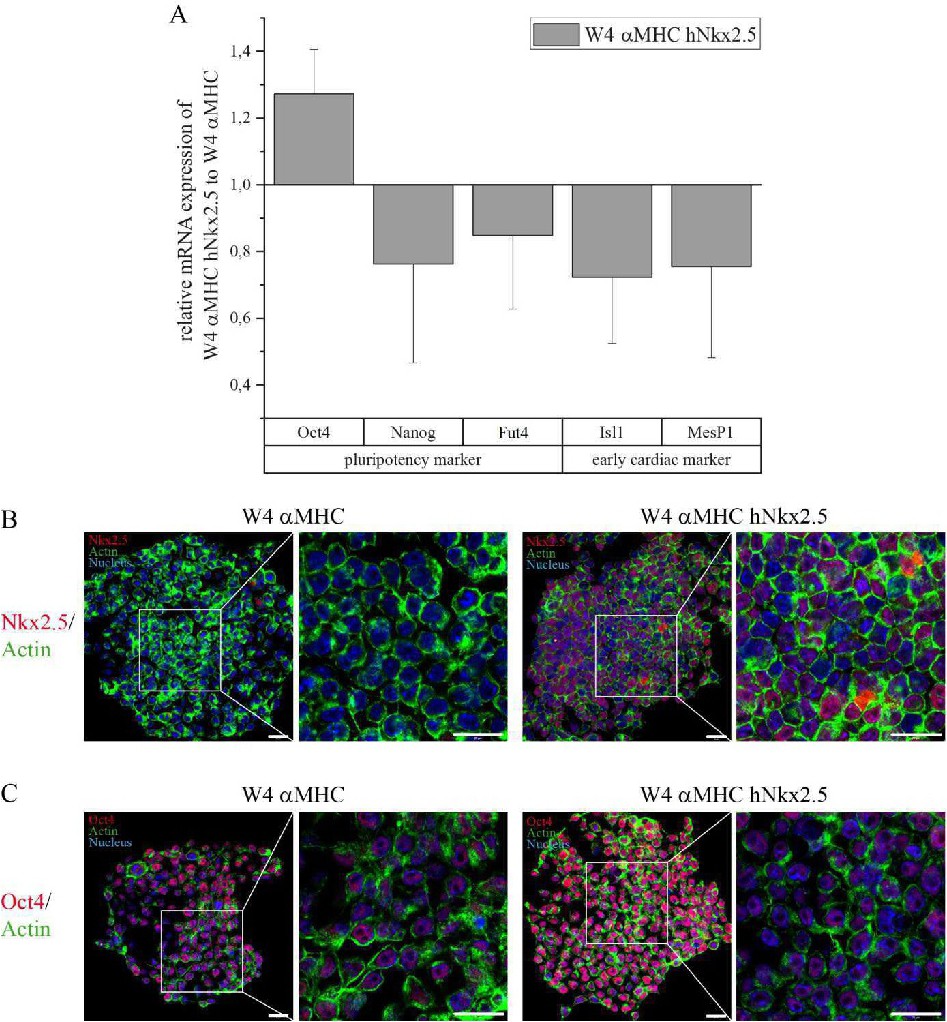
Fig. 1. Description of the original mES cell state: Marker expression of W4 αMHC and W4 αMHC hNkx2.5 clones on day 0 of differentiation. (A) Relative expression of pluripotency and early cardiac markers performed by qPCR. Values relativized to W4 αMHC (set: 1). Values are presented as mean ± SEM; n=3; statistic was performed as t-test. (B) Confirmation of Nkx2.5 overexpression on protein level using immunostaining of actin (green) and exogenous Nkx2.5 (red), scale bar: 20 µm. (C) Confirmation of pluripotency on protein level using immunostaining of actin (green) and Oct4 (red), scale bar: 20 µm.